Manifold reconstruction of monkey (V1) LFP#
import sys
sys.path.insert(0, '/home/rudra/Documents/NeuralFieldManifold')
Loaded LFP: (1011623, 1024) (samples x channels)
V1 channels: 896, V4 channels: 128
xs, xs_raw = process_signal(LFP, chan, Fs, time_window,
                            bandpass_low=1.0, bandpass_high=50.0,
                            fband=(1, 80), env_lp_hz=3.0)

time = np.arange(len(xs)) / Fs
print(f"Processed channel {chan}: {len(xs)} samples")
Processed channel 1001: 10000 samples
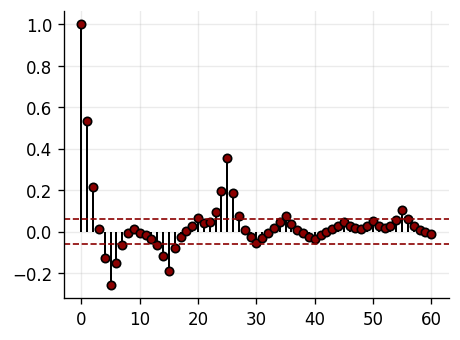
# Sweep AR orders for elbow plot
p_list = list(range(2, 7))
mse_te_list = []
for p in p_list:
    X, y_temp = AR.lag_matrix(xs, p)
    ntr_temp = int(0.9 * len(y_temp))
    X_tr, y_tr = X[:ntr_temp], y_temp[:ntr_temp]
    X_te, y_te = X[ntr_temp:], y_temp[ntr_temp:]
    w_temp = AR.fit(X_tr, y_tr)
    yhat_te = AR.predict_from_params(X_te, w_temp)
    mse_te, _, _ = AR.metrics(y_te, yhat_te)
    mse_te_list.append(mse_te)

best_p_by_mse = p_list[int(np.argmin(mse_te_list))]

def plot_mse_elbow(p_list, mse_list, best_p, color_main="black", color_alt="darkred"):
    fig, ax = plt.subplots(figsize=(4, 3))
    ax.plot(p_list, mse_list, marker='o', color=color_main, lw=1.5, ms=5)
    ax.axvline(best_p, linestyle='--', color=color_alt, linewidth=1)
    ax.text(best_p, ax.get_ylim()[1]*0.95, f"best p={best_p}", ha='center', va='top', color=color_alt, fontsize=11)
    sf = ScalarFormatter(useMathText=True)
    sf.set_powerlimits((-3, 3))
    ax.yaxis.set_major_formatter(sf)
    ax.ticklabel_format(axis='y', style='sci', scilimits=(-3, 3))
    ax.yaxis.get_offset_text().set_size(10)
    prettify(ax, title="AR(p) elbow: Test MSE vs p", xlabel="Order p", ylabel="Test MSE")
    plt.tight_layout()
    plt.show()

plot_mse_elbow(p_list, mse_te_list, 4)
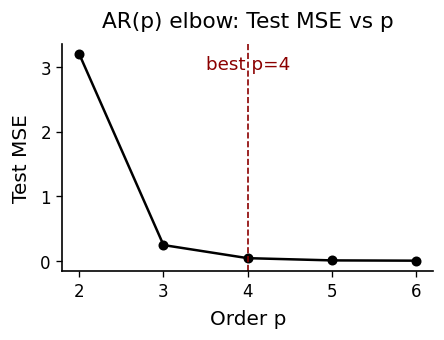
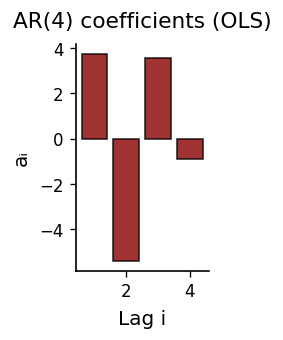
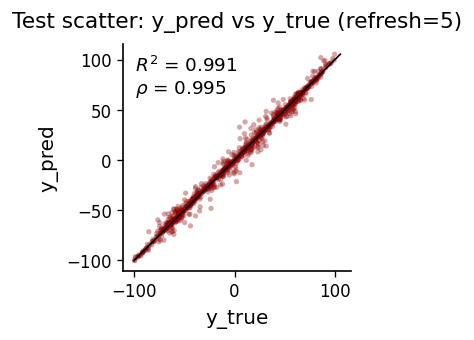
AR(4): MSE=23.665544, corr=0.995
/tmp/ipykernel_2090445/1968211041.py:30: UserWarning: Tight layout not applied. The left and right margins cannot be made large enough to accommodate all Axes decorations.
  plt.tight_layout(pad=2.5)
/tmp/ipykernel_2090445/1952607524.py:51: UserWarning: Tight layout not applied. The left and right margins cannot be made large enough to accommodate all Axes decorations.
  plt.tight_layout(pad=2.5, w_pad=1.5)
/tmp/ipykernel_2090445/698833246.py:49: UserWarning: Tight layout not applied. The left and right margins cannot be made large enough to accommodate all Axes decorations.
  plt.tight_layout(pad=2.5, w_pad=1.5)
def sweep_channels_plot(LFP, channels, time_windows, taus, Fs,
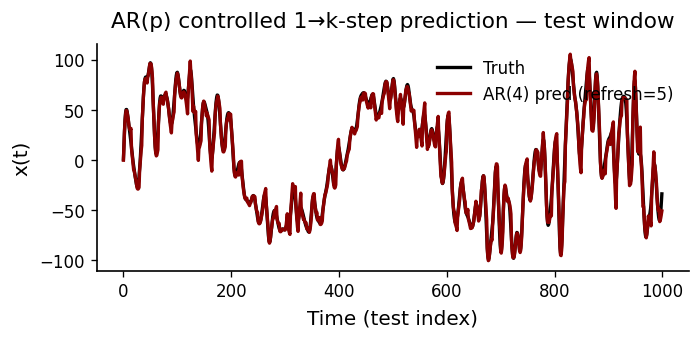
p=4, train_frac=0.9, refresh_every=5,
bandpass_low=1.0, bandpass_high=50.0, fband=(1, 80), env_lp_hz=3.0,
embed_dim=3):
"""
Process multiple channels and plot state space comparison.
Parameters
----------
channels : list of int
Channel indices to process
time_windows : list of tuple
(start_sec, end_sec) for each channel's plot window
taus : list of int
Embedding delay for each channel
"""
from matplotlib.ticker import MultipleLocator
n = len(channels)
fig, axes = plt.subplots(1, n, figsize=(n*4.5, 5), subplot_kw={'projection': '3d'})
if n == 1:
axes = [axes]
for ax, chan, (t_start, t_end), tau in zip(axes, channels, time_windows, taus):
# Process full signal for this channel
xs, _ = process_signal(LFP, chan, Fs, np.arange(int(t_end * Fs) + 100),
bandpass_low=bandpass_low, bandpass_high=bandpass_high,
fband=fband, env_lp_hz=env_lp_hz)
# Fit AR model
ar_res = fit_ar_model(xs, Fs, p=p, train_frac=train_frac, refresh_every=refresh_every)
w, xs_pred_full = ar_res['w'], ar_res['xs_pred_full']
# Extract window
idx_start, idx_end = int(t_start * Fs), int(t_end * Fs)
segment_true = xs[idx_start:idx_end]
segment_pred = xs_pred_full[idx_start:idx_end]
# Variance-match prediction
seg_pred_matched = segment_pred - np.mean(segment_pred)
seg_pred_matched = seg_pred_matched * (np.std(segment_true) / (np.std(seg_pred_matched) + 1e-12))
seg_pred_matched = seg_pred_matched + np.mean(segment_true)
# Embed
X3_true = embed(segment_true, embed_dim, tau)
X3_pred = embed(seg_pred_matched, embed_dim, tau)
# Plot
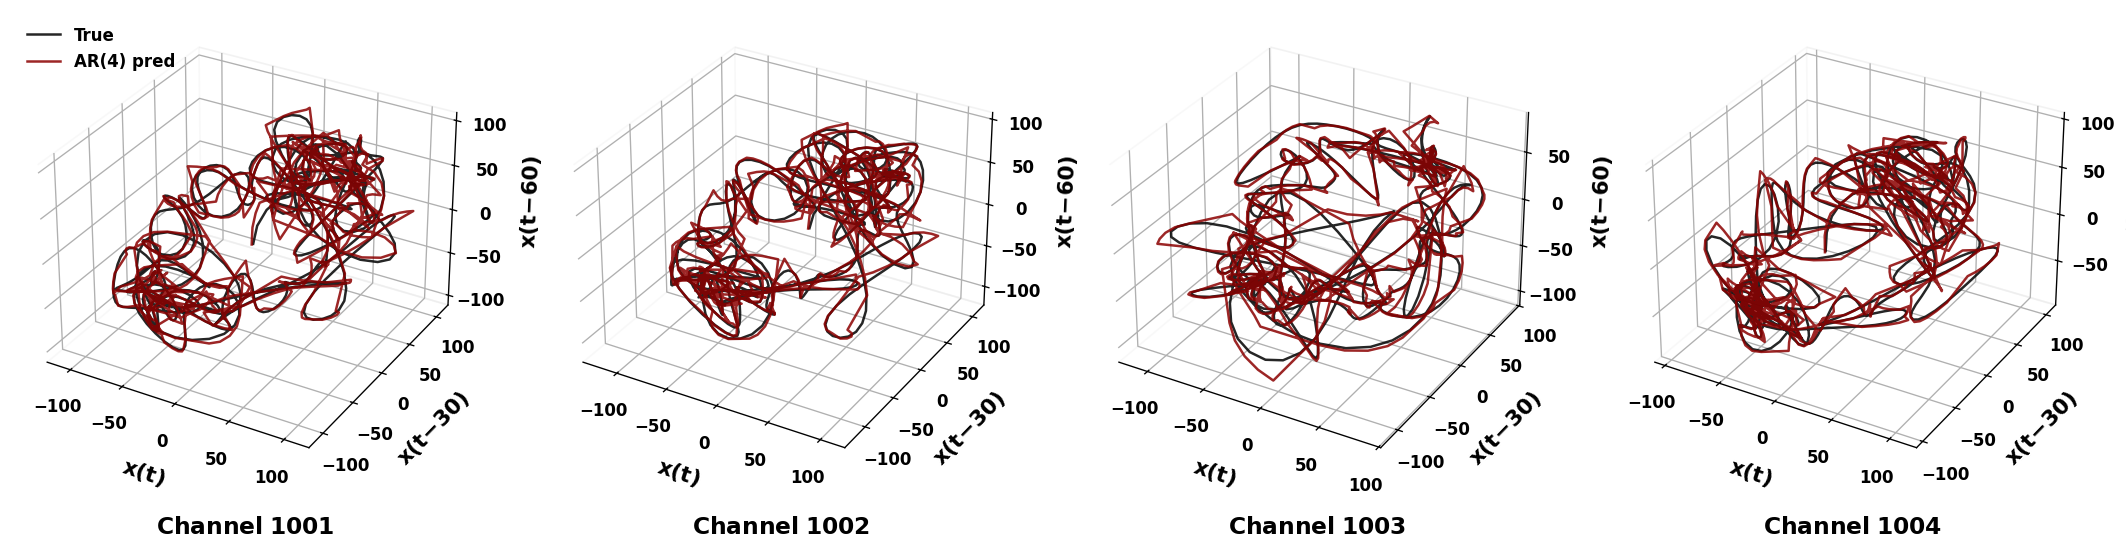
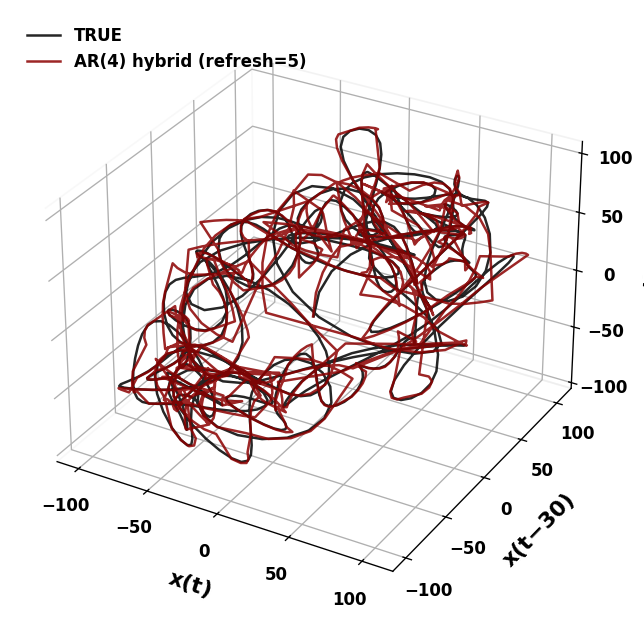
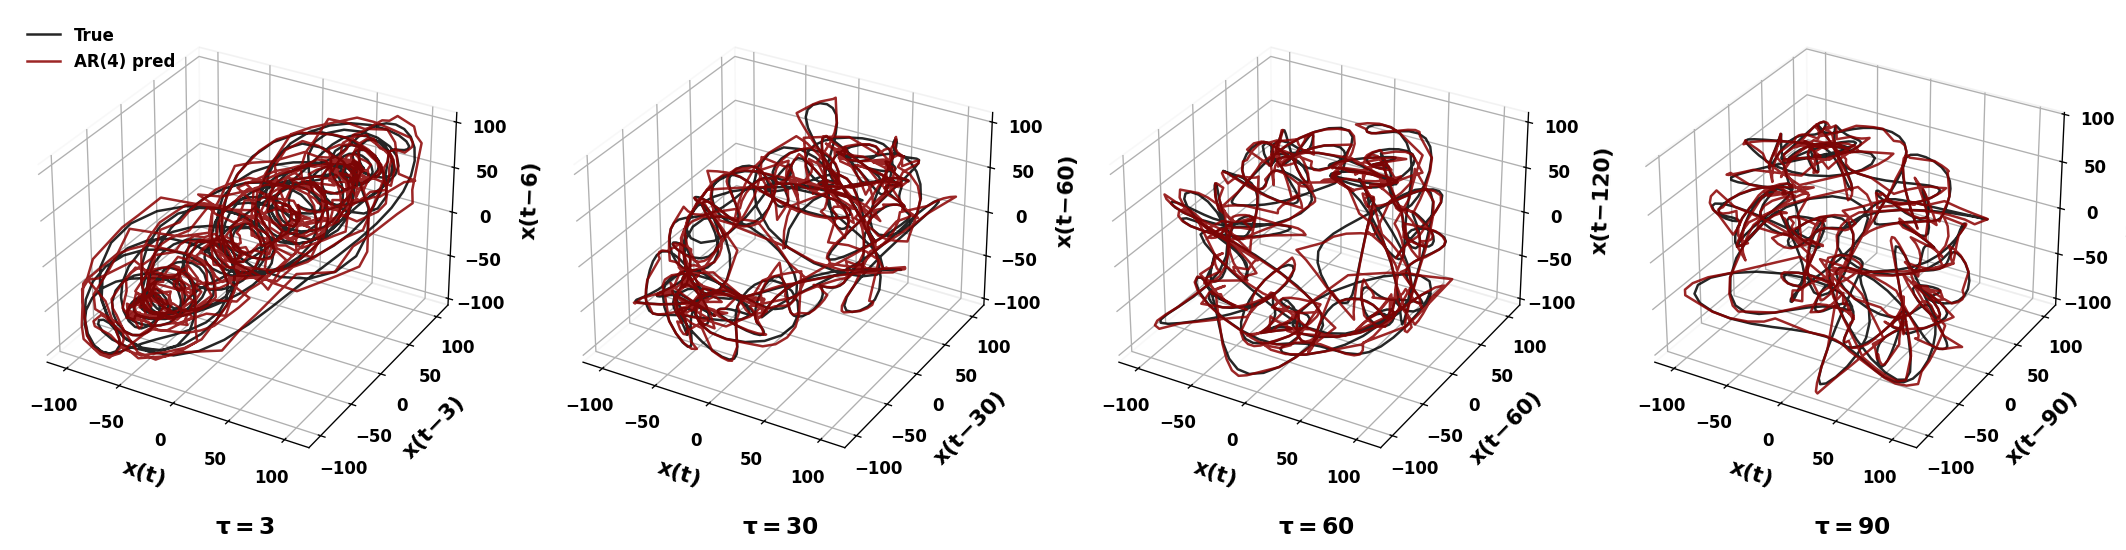
ax.plot(X3_true[:, 0], X3_true[:, 1], X3_true[:, 2], color='black', alpha=0.85, lw=1.5, label='True')
ax.plot(X3_pred[:, 0], X3_pred[:, 1], X3_pred[:, 2], color='darkred', alpha=0.85, lw=1.5, label=f'AR({p}) pred')
# Bold axis labels (LaTeX)
ax.set_xlabel(r"$\mathbf{x(t)}$", labelpad=8, fontsize=13)
ax.set_ylabel(f"$\\mathbf{{x(t\\!-\\!{tau})}}$", labelpad=8, fontsize=13)
ax.set_zlabel(f"$\\mathbf{{x(t\\!-\\!{2*tau})}}$", labelpad=8, fontsize=13)
# Clean tick spacing: increments of 50
ax.xaxis.set_major_locator(MultipleLocator(50))
ax.yaxis.set_major_locator(MultipleLocator(50))
ax.zaxis.set_major_locator(MultipleLocator(50))
ax.tick_params(axis='both', pad=4, labelsize=10)
# Bold tick labels
for label in ax.xaxis.get_ticklabels() + ax.yaxis.get_ticklabels() + ax.zaxis.get_ticklabels():
label.set_fontweight('bold')
# Remove grey background panes
ax.xaxis.pane.fill = False
ax.yaxis.pane.fill = False
ax.zaxis.pane.fill = False
# Bold channel annotation
ax.text2D(0.5, -0.12, f"$\\mathbf{{Channel \\; {chan}}}$",
transform=ax.transAxes, ha='center', fontsize=14, fontweight='bold')
axes[0].legend(frameon=False, loc='upper left', fontsize=11,
prop={'weight': 'bold'})
fig.subplots_adjust(left=0.02, right=0.98, bottom=0.12, top=0.95, wspace=0.15)
plt.tight_layout(pad=2.5, w_pad=1.5)
plt.savefig("3.pdf", bbox_inches='tight', dpi=300)
plt.show()
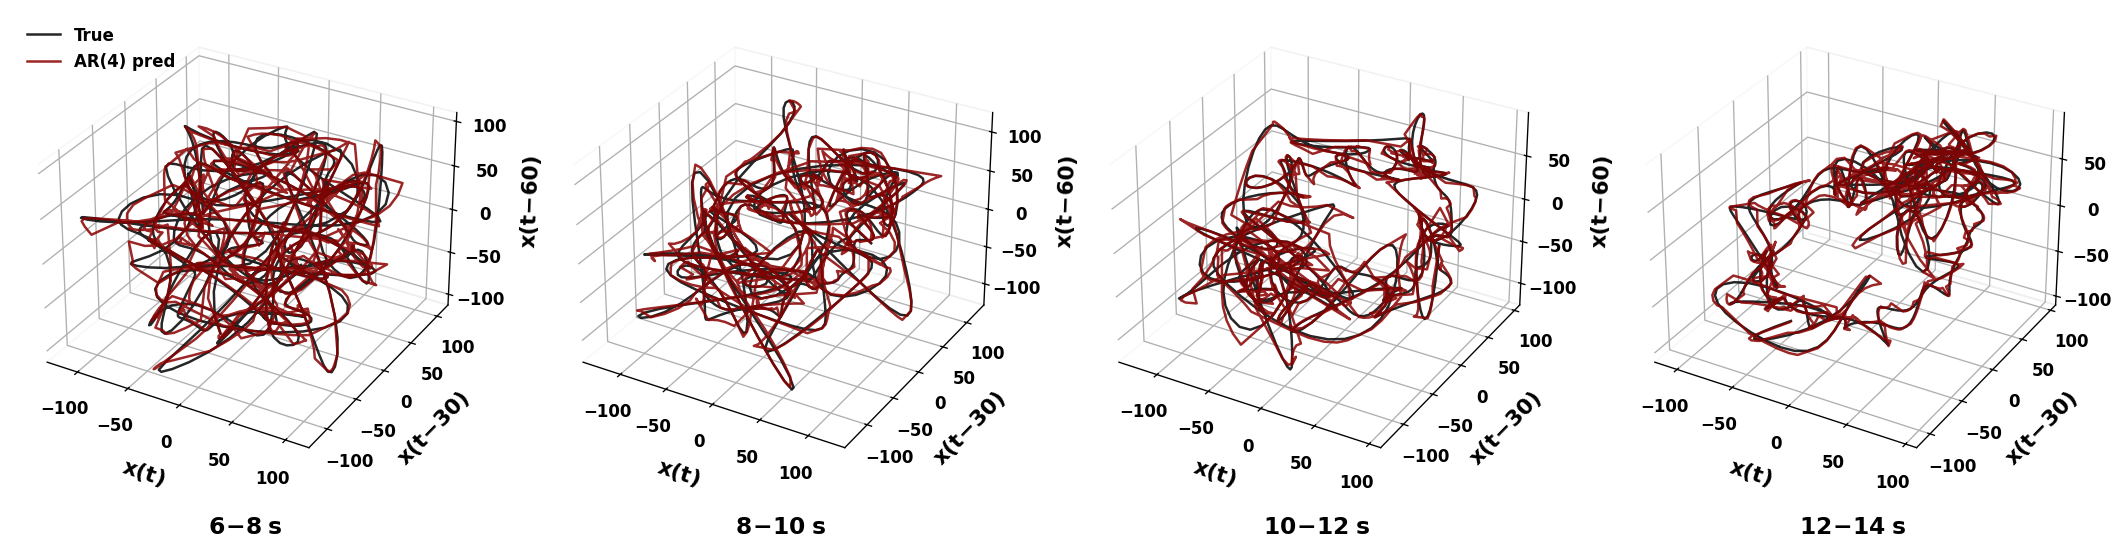
sweep_channels_plot(
LFP,
channels=[1001, 1002, 1003, 1004],
time_windows=[(18, 20), (18, 20), (10, 12), (18, 20)],
taus=[30, 30, 30, 30],
Fs=Fs
)
/tmp/ipykernel_2090445/874268918.py:78: UserWarning: Tight layout not applied. The left and right margins cannot be made large enough to accommodate all Axes decorations.
  plt.tight_layout(pad=2.5, w_pad=1.5)